Featured Spatial Mapping Projects
About Us
Maximum City is the proud recipient of the 2025 Making a Difference Award from Esri Canada.
Maximum City is a social enterprise based in Toronto serving schools, school boards, municipalities, nonprofits, and sport organizations.
We create systems change at the intersection of education and community.
LEARN MORE ABOUT OUR APPROACH — email team@maximumcity.ca to book a meeting.
KidScore
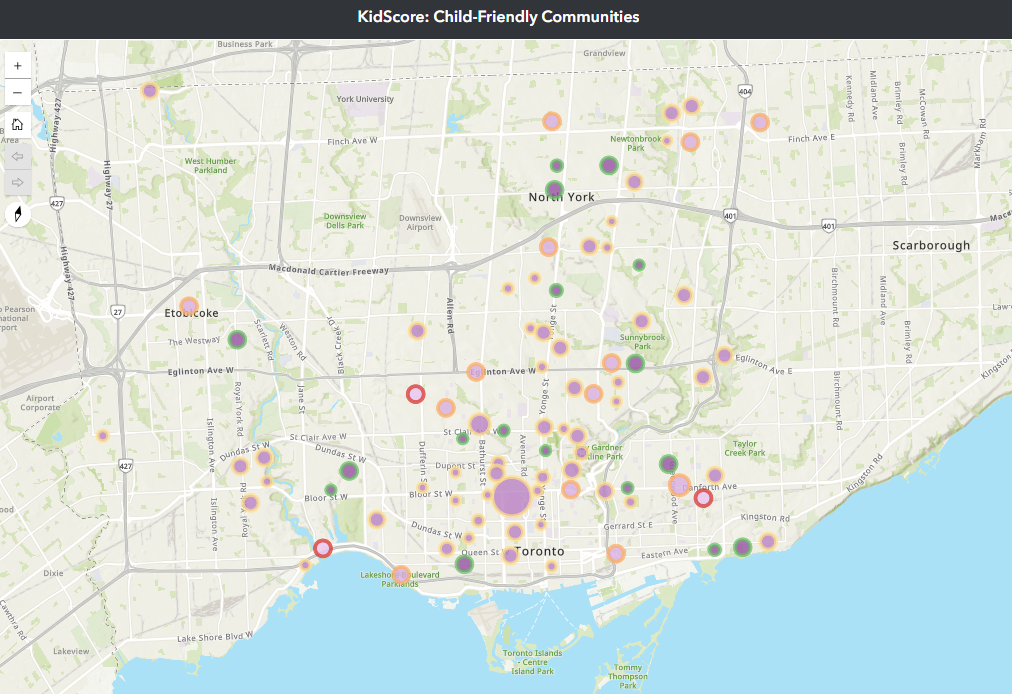
KidScore maps child-friendly experiences in communities across Canada by inviting young people ages 5+ to explore a neighbourhood and assess what they like and dislike.
First, they go for a local walk (e.g. to school or a friend’s house) with their senses and observational skills turned up. Then, they take a short, anonymous survey that asks them about what they saw and felt.
When the survey is submitted, a score is created automatically - the KidScore for the area explored, expressed as an overall score out of 100, as well as scores out of 100 in four categories: Getting Around; Spaces, Senses, & Activities; Green Space & Environment; and Safety & Well-being.

The results are populated to a dashboard that maps KidScores for places across Canada and around the world, with category-specific gauges and custom “report cards” for every area.
KidScore data creates connections to place and amplifies youth voice, while helping city officials and designers plan better cities for young people.
In 2020, a KidScore program in nine communities, created by Maximum City for the City of Toronto, won the International Association for Public Participation’s Core Values Award for Diversity and Inclusion.
Esri Products:
Survey123
Experience Builder
active school travel study
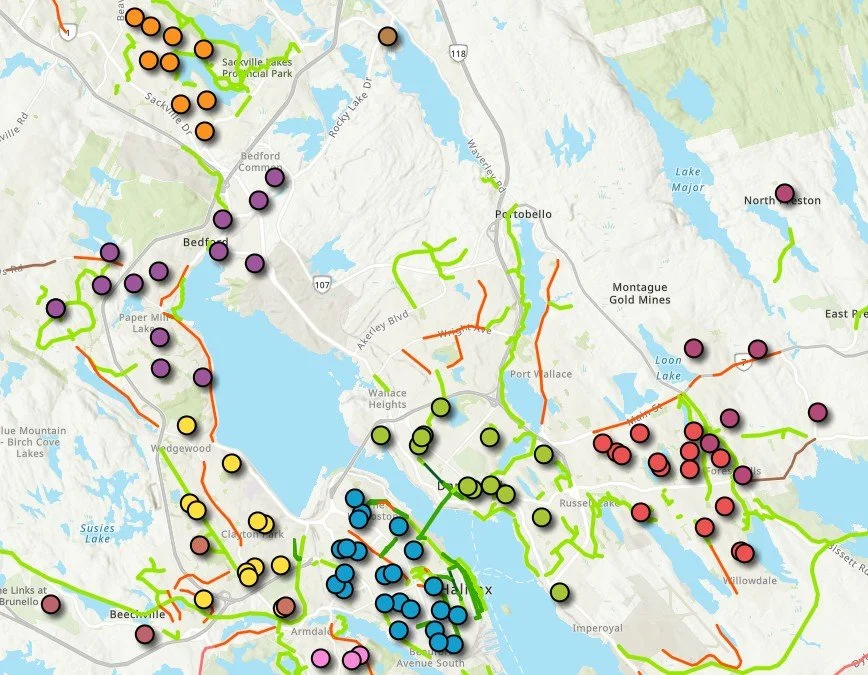
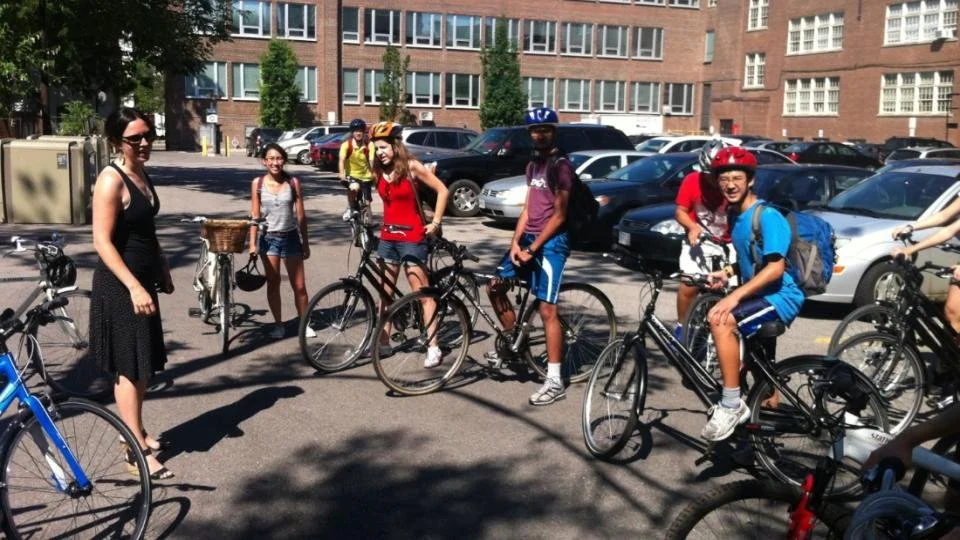
The Active School Travel study identifies local conditions for walking & biking to school. Walking or biking to school improves health and academic outcomes, reduces traffic congestion, and lowers environmental impacts.
Our partner lacked the detailed information needed to identify where active school travel initiatives would have the greatest impact. We grouped all schools in the region based on factors such as the built environment, school catchment areas, and tax boundaries.
Using mode share data for school-aged children at the Forward Sortation Area (FSA) level, combined with additional demographic and transportation data, we identified areas with the greatest opportunity to increase active transportation, and which areas needed more support. This allows us to identify both clusters and individual schools that are ready to implement active school travel programs, while identifying needed supports and infrastructure.
Esri Products:
Experience Builder
WORLD CUP RIGHTS & SITES DASHBOARD
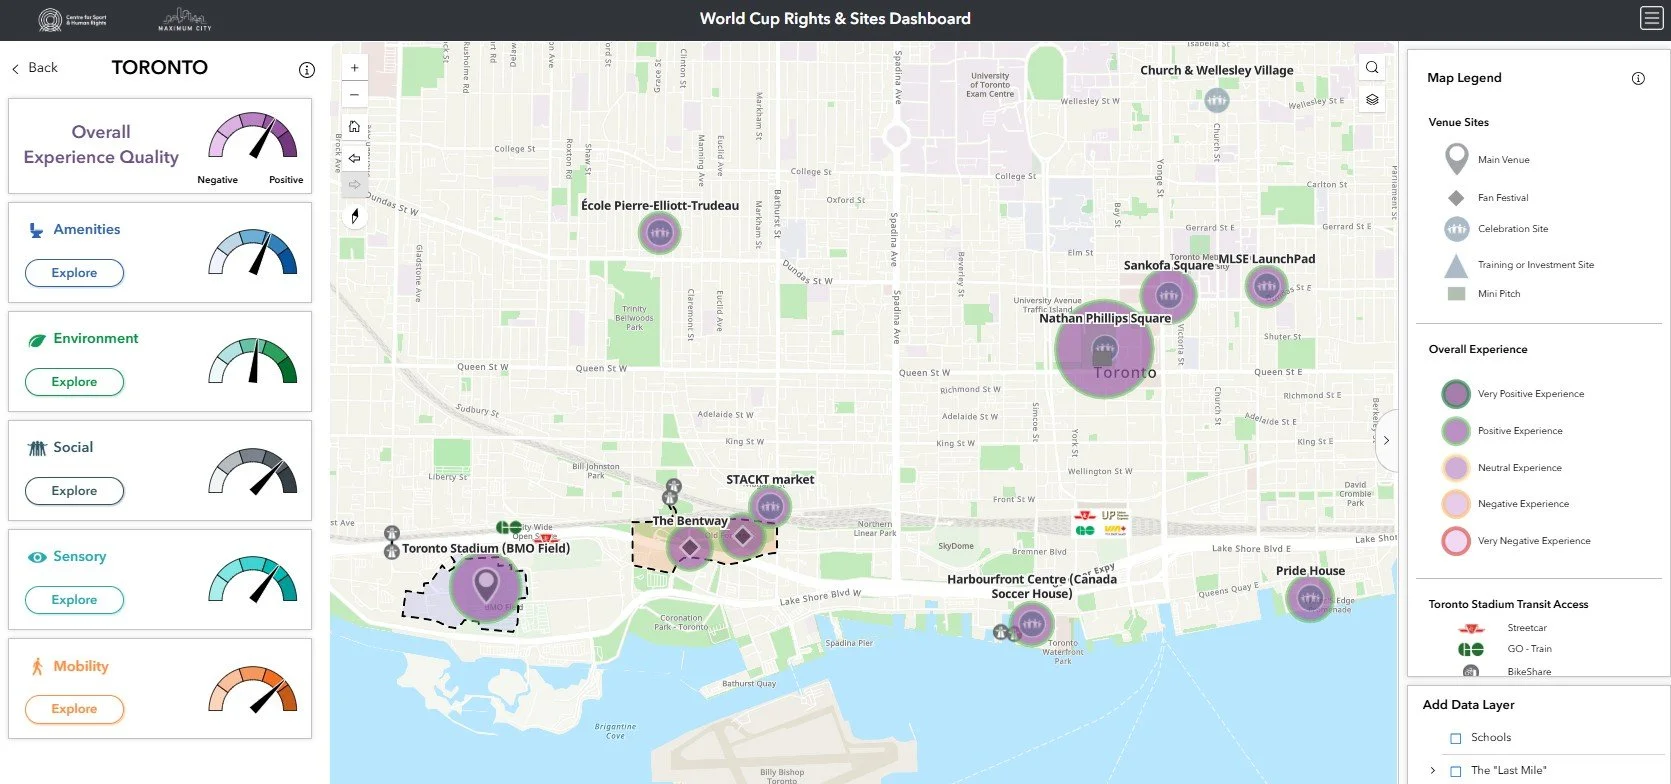
The World Cup Dashboard helps organizers plan better large-scale events for families by analyzing the spatial experiences of children in and youth in and around 2026 Men’s World Cup venues and fan sites in Toronto, Guadalajara, and New York/New Jersey.
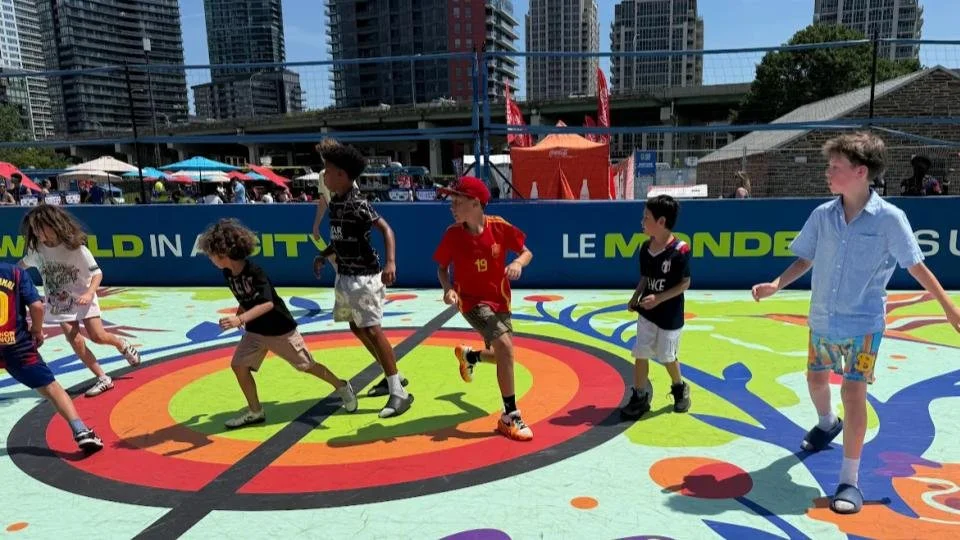
We developed a survey based on youth-approved indicators and created an interactive dashboard that shares the self-reported experiences of children and youth near venues and fan sites. The dashboard integrates survey responses with city-level data while identifying opportunities to improve event-time experiences for families.
Each city-specific version of the dashboard displays overall experiences, along with deep-dive data across five experiential categories: Amenities; Environment; Social; Sensory; and Mobility.
Esri Products:
Survey123
Experience Builder
